Structural analysis with industrial computed tomography scanning
3D insight into cell structure & particle distribution – without destruction
Open-cell and closed-cell foam, damping material, or particle-filled polymers only fulfill their function if the pore size, cell density, or filler are evenly distributed. In analysis, optical microscopy only provides cross-sectional images; ultrasound only works on components with flat surfaces, but not on organically shaped structures. CT scan services by TPW CTinspect capture the entire volume non-destructively and create a color-coded 3D heat map of the foam structure as well as a statistical analysis of the pore spaces. The same procedure can also be used to examine bulk materials in terms of particle size. This allows tool or mixing parameters to be optimized in a targeted manner to ensure consistent component performance – from lightweight construction to additively manufactured medical technology implants. After the CT scan has been completed, we offer you a free 1:1 analysis of your data via video call.
Core functions of CT-based foam and structure analysis
- 3D heat map of the cell structure: Visual hot spot detection of density deviations and pore size deviations
- Automatic porosity histogram: Statistically reliable proof of component quality
- Particle size analysis & position analysis: Detects filler agglomerates, sedimentation, or inclusion clusters
- Comparison to cross-section: Volume data without destruction – thousands of virtual cutting planes instead of a few visible cuts
- Certified testing and testing laboratory: DIN EN ISO/IEC 17025:2018 and DIN EN 15708-3
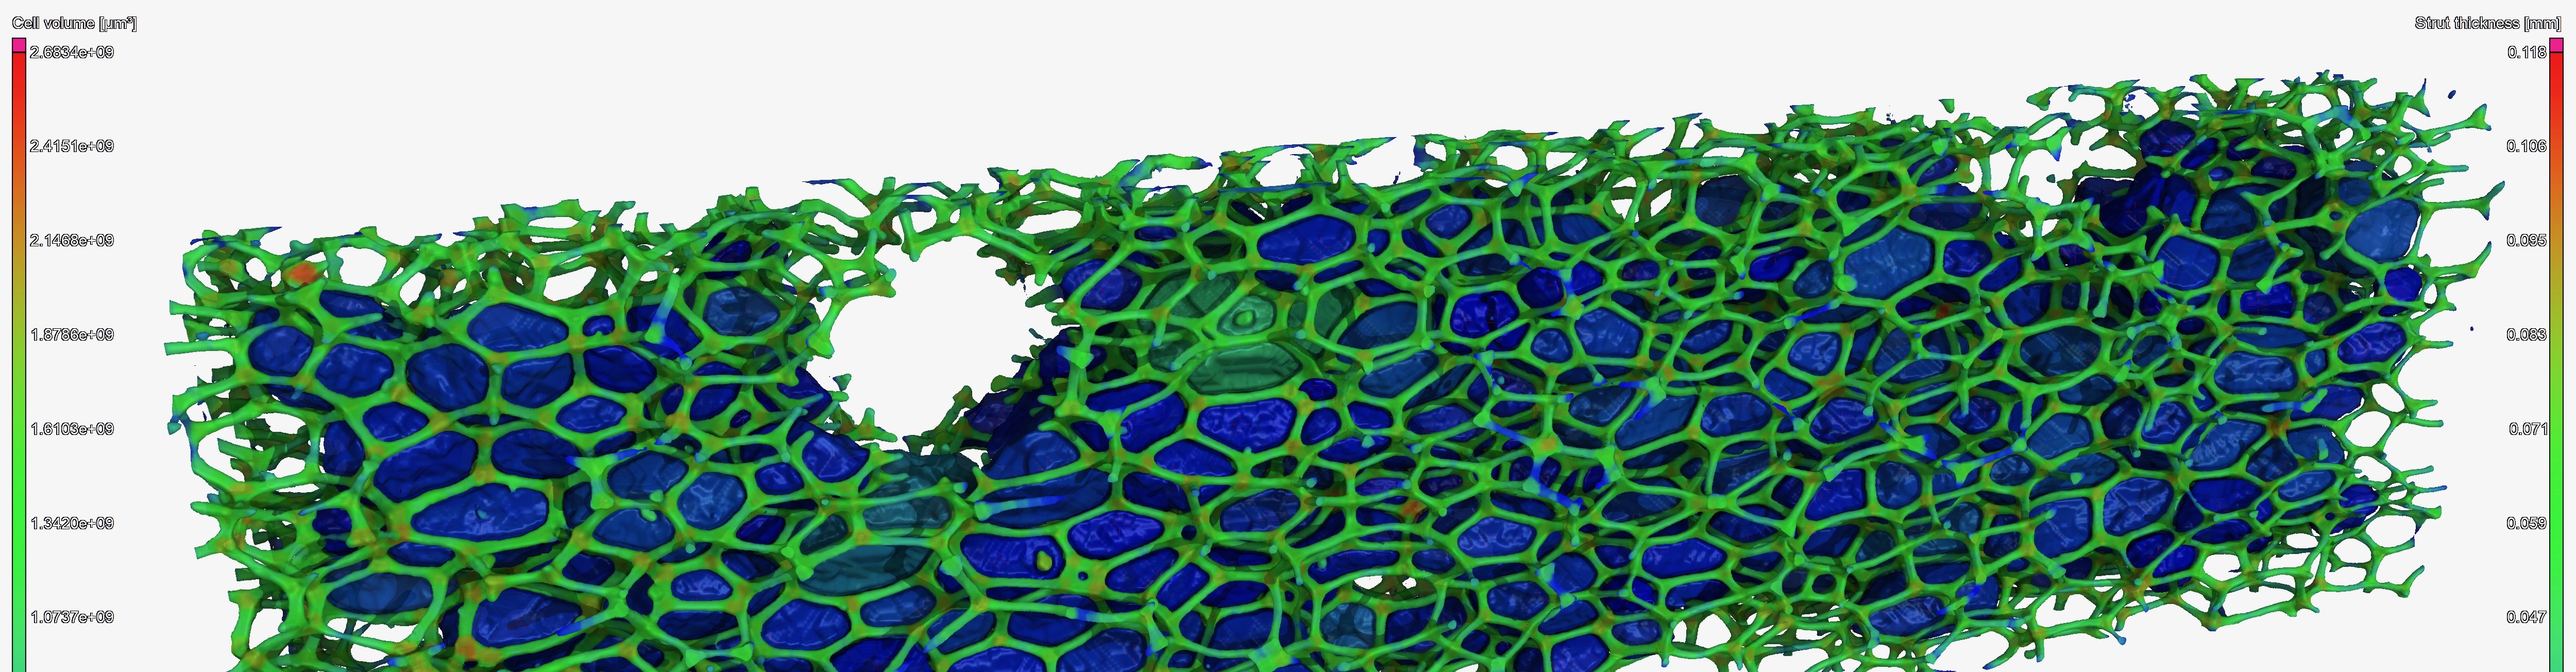
Application example – pore distribution in foam with statistical size analysis
Structural analysis of foams helps developers make statements about technical properties. Whether the focus is on energy absorption, acoustic damping, or maintaining a defined elasticity: To ensure that the end product has the desired pore geometry, the entire molded part or a piece of foam is examined using computed tomography scanning. The volumetric image segments each individual pore – even those in interior areas that are not visually accessible. A major advantage is that, since the measurement is non-contact, there is no deformation of the flexible materials during the measurement.
Based on this data, the software generates a color-coded 3D heat map that intuitively visualizes the pore distribution. At the same time, a statistical size analysis is performed: Each pore is assigned a specific ID (identification number), and its volume and equivalent diameter are entered into a histogram and a cumulative frequency distribution. The results table can be exported as CSV or Excel.
Materials that can be tested for foam or particle structure using industrial CT scanning
Industrial CT can be used to test a variety of materials. Here are a few selected foams and foamed materials:
- Polyurethane, phenolic, EP, and silicone foams (open-cell/closed-cell)
- Aluminum and titanium metal foams in medical technology
- Particle-filled thermoplastics (GF, CF, hollow glass spheres)
- Powder fillings
- Gravel/rock samples
This is how your CT scan works:
| 1. Joint definition of objectives | Im unverbindlichen Erstgespräch beraten Sie unsere Fachexpert:innen hinsichtlich der Prüfkriterien (Material, Scan-Auflösung etc.) und legen die zu analysierende Bereiche (Teilscan / Point-of-Intrest oder Gesamtscan) fest. |
| 2. Quick quote | You will receive a comprehensive quote at a fixed price usually on the same working day. |
| 3. Logistics | You send or deliver your component to TPW CTinspect in Neuss, Germany. Non-disclosure agreements (NDAs) are a matter of course for us. |
| 4. CT inspection | We carry out the certified CT scan within a few working days in our accredited testing laboratory. We agree on your individual schedule in advance and confirm it in the quote. |
| 5. Analysis & reporting | You will receive the measurement data prepared for you in our secure download area (e.g., 3D volume model, cross-sectional images, and/or test report including false color representation or statistics). |
| 6. Our service | Upon request, we will discuss your data in a video meeting and analyze it together. Benefit from our decades of experience in CT services—free of charge! |
We deliver these results:
- CT volume data set (.vgl) with segmented cell or particle structure
- Color heat map (viewer file) of the pore or particle distribution
- Statistics report (CSV/XLS) including porosity histogram & particle size distribution
- Password-protected 3D analysis data on a German server
- If required: support in interpreting the data by our CT specialists
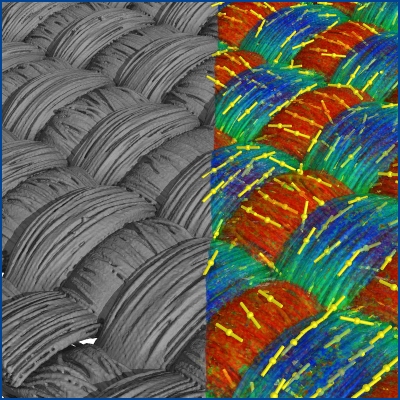
Analyze fiber orientation
Reliably analyze the fiber orientation of GRP, CFRP, or other composite materials with industrial CT scanning.
LEARN MORE
Accredited testing laboratory
Our testing laboratory is accredited according to DIN EN ISO/IEC 17025:2018.
LEARN MORE
TPW CTinspect GmbH
For more than two decades, we provide CT scanning services to our global customer base.
LEARN MORE